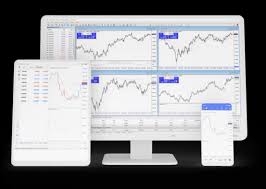
How to Read Forex Charts Like a Pro on MetaTrader 4
Forex trading requires understanding and analyzing price charts. MetaTrader 4 (MT4), one of the most popular trading platforms, offers powerful tools to view and interpret these charts effectively. If you’re just starting out or want to polish your chart-reading skills, this guide will help you master the basics of reading forex market charts like a pro.
Types of Charts on MetaTrader 4
MT4 provides three primary chart types, each offering unique insights into currency pair movements.
1. Line Charts
Line charts are the most basic and straightforward type. They connect closing prices of a currency pair over a specific period of time, creating a line that shows the overall trend. This chart is useful for identifying long-term trends but lacks detailed insights.
2. Bar Charts
Bar charts offer more details than line charts. Each bar represents a specific time period (e.g., an hour or a day) and includes four key data points:
• Open (where the price started),
• High (the highest price),
• Low (the lowest price), and
• Close (the ending price).
Bar charts are perfect for traders who want to grasp price volatility within a given period.
3. Candlestick Charts
Candlestick charts are the go-to choice for many Forex traders because they provide a rich amount of information at a glance. Each candle represents a specific timeframe and displays the same four data points as a bar chart. The “body” of the candle indicates the range between open and close prices, while the “wicks” or “shadows” show the highs and lows.
Green or white candles signify upward movement (bullish), while red or black candles indicate a downward trend (bearish).
Navigating MT4 to Read Charts
MT4 makes it easy to customize and analyze Forex charts. Here’s how to get started:
1. Selecting a Chart Type
On the top toolbar, choose between Line, Bar, and Candlestick charts. Pick the one that best fits your trading style.
2. Zooming and Timeframes
Adjust the chart’s timeframe to suit your analysis. MT4 allows you to switch between various timeframes, ranging from 1-minute (M1) to monthly (MN). Shorter timeframes are better for day traders, while longer ones help long-term investors.
3. Adding Indicators
Boost your analysis by including indicators like Moving Averages, Bollinger Bands, and RSI. These tools are available in MT4’s “Insert” menu and help spot trends and potential entry or exit points.
4. Reading Support and Resistance Levels
Identify support (a price level where demand might push prices higher) and resistance (a level where selling pressure could drive prices lower). Most traders rely on MT4’s horizontal lines to mark these critical levels.
Refining Your Skills
Mastering chart-reading on MT4 requires consistent practice. Start with demo accounts to experiment with different chart types, timeframes, and strategies. Over time, you’ll learn to spot patterns and make informed trading decisions.
Reading Forex charts like a pro on MetaTrader 4 is an essential skill for trading success. By understanding different chart types, customizing tools, and practicing regularly, you can gain an edge in the dynamic Forex market.